
Don't you want to read? Try listening to the article in audio mode 🎧
Article updated on: 09 August 2023

Keep reading

What Project Managers do, how to become one and how much they earn
Nowadays companies, whether large or medium-small, or even startups, are increasingly resorting to project management ...
12/05/2022

Faculty Stories: Dominik Berger, Content Strategist
Dominik Berger is the Founder and Content Strategist at Attention Fox. Besides that, he will be sharing his knowledge ...
13/08/2019

The Difference Between Data Engineer, Data Scientist, and Data Analyst
In today’s modern world, organizations rely on data science to make informed decisions and strategies. As a result, the ...
23/09/2021
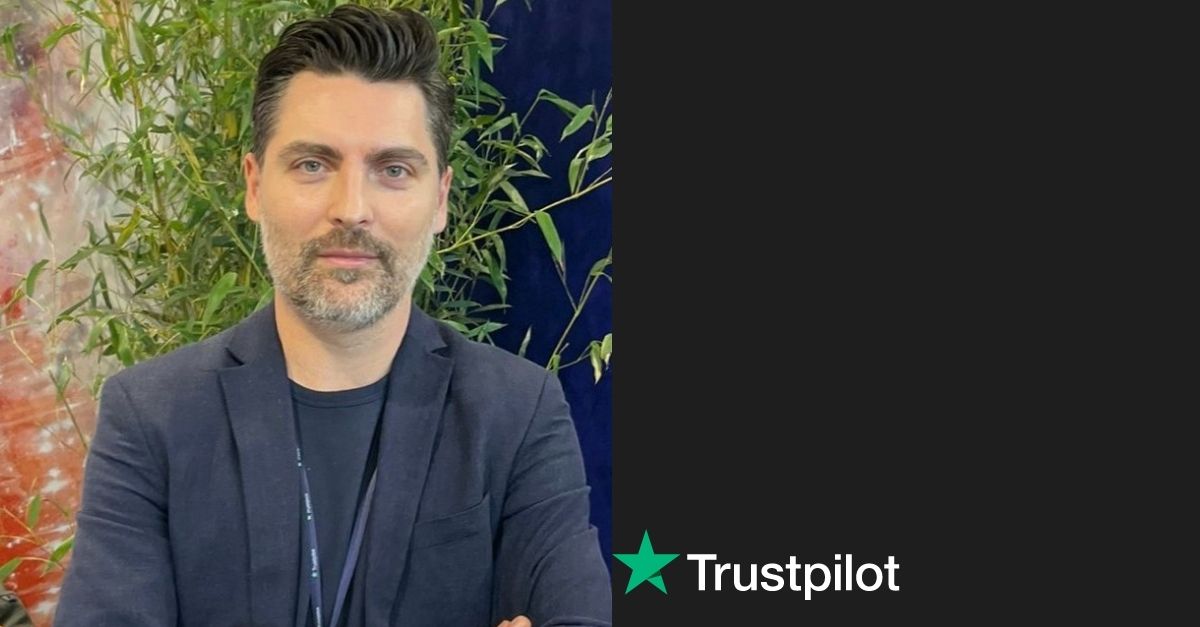
What’s the most important thing when building a great business?
By Claudio Ciccarelli, Country Manager at Trustpilot in Italy A good website? A great product? Whilst
12/05/2022